US Rental Market 2025: Median Rents, Growth Rates & Vacancy Data for 20 Major Cities
Explore the 2025 US rental market with data on median rents, year-over-year growth, vacancy rates, and days on market across 20 major cities. Visual infographic included.
The 2025 US Rental Market at a Glance
The US rental market continues to shift in 2025, with significant variation across cities in rent levels, growth rates, and vacancy. Whether you're a landlord setting rent prices, an investor evaluating markets, or a tenant planning a move, understanding these trends is essential.
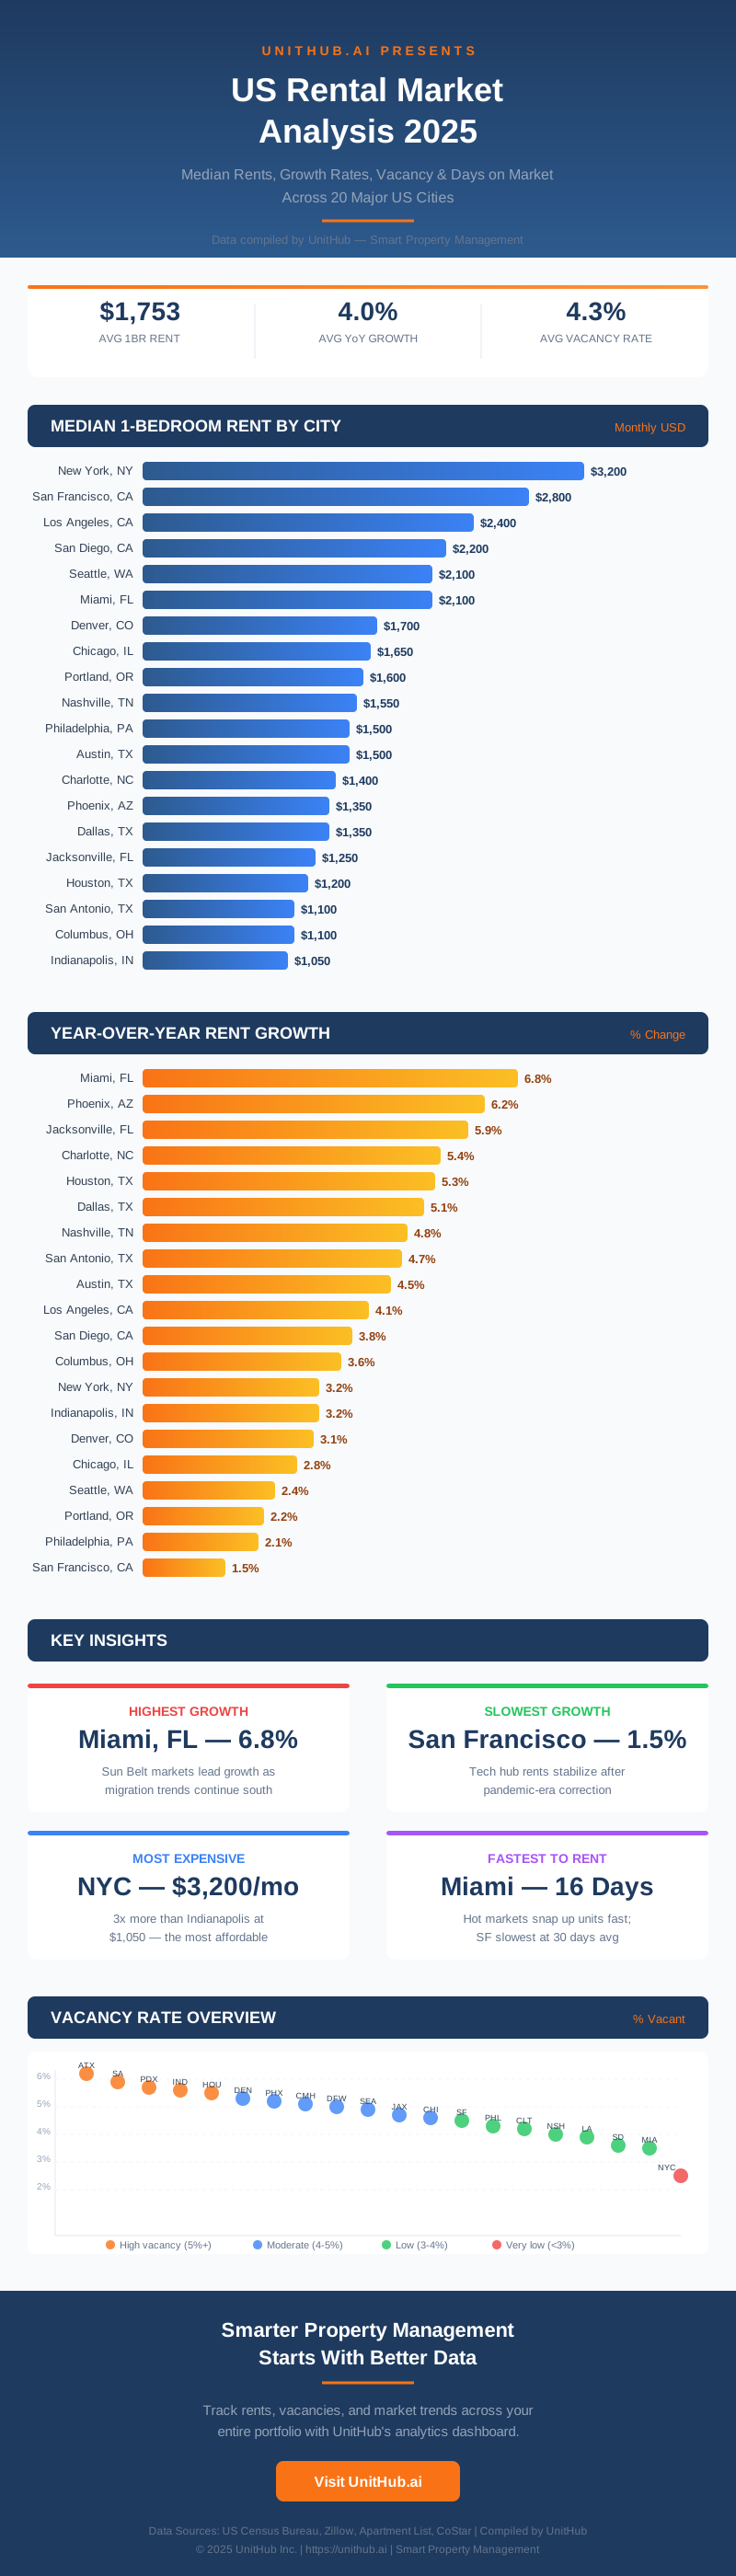
We compiled data from the US Census Bureau, Zillow, Apartment List, and CoStar to bring you a snapshot of 20 major US cities. The infographic below visualizes the key metrics.
Infographic: US Rental Market 2025
*Data sources: US Census Bureau, Zillow, Apartment List, CoStar Group*
Median Rents by City
New York remains the most expensive rental market, with a median 1-bedroom rent of $3,200 and 2-bedroom at $4,500. San Francisco ($2,800/$3,800) and Los Angeles ($2,400/$3,200) round out the top three.
At the more affordable end, Indianapolis ($1,050/$1,300), Columbus ($1,100/$1,400), and San Antonio ($1,100/$1,400) offer significantly lower rents, making them attractive markets for both tenants and investors seeking higher yield.
Key takeaway: There is roughly a 3x difference between the most and least expensive major markets for 1-bedroom apartments.
Year-over-Year Rent Growth
Miami leads all 20 cities with a 6.8% year-over-year rent increase, followed by Phoenix (6.2%) and Jacksonville (5.9%). Sun Belt and Texas cities dominate the high-growth category, reflecting continued migration patterns.
On the slower growth side, San Francisco (1.5%), Philadelphia (2.1%), and Portland (2.2%) show more moderate increases. San Francisco's lower growth rate may reflect a market correction after years of rapid increases and rising remote work adoption.
Key takeaway: Sun Belt cities continue to see the strongest rent growth, driven by population inflows and job market expansion.
Vacancy Rates & Days on Market
Austin leads vacancy rates at 5.8%, followed by San Antonio (5.5%) and Portland (5.3%). These higher vacancy rates give tenants more negotiating power and suggest increasing supply in these markets.
New York has the tightest market with just 2.1% vacancy, followed by Miami (3.1%) and San Diego (3.2%). Low vacancy in these cities keeps upward pressure on rents.
Miami also has the shortest average days on market at just 16 days, while San Francisco has the longest at 30 days. Faster lease-up times generally indicate stronger tenant demand.
Key takeaway: Markets with both low vacancy and fast lease-up times (Miami, New York, Austin) represent the strongest landlord markets in 2025.
What This Means for Property Managers
Understanding local market conditions is critical for setting competitive rents, minimizing vacancy, and maximizing returns. With rents, growth rates, and vacancy varying so widely across cities, a one-size-fits-all approach to property management doesn't work.
UnitHub helps landlords and property managers stay on top of their local market with tools for rent tracking, tenant management, and financial reporting — all in one place.
[Sign up for UnitHub free](https://unithub.ai) to start managing your properties smarter.
related_features
related_features_description
ニュースレターを購読
物件管理、自動化、AI、賃貸ポートフォリオの拡大に関する週刊ヒントをお届けします。
